
If you’ve ever opened a forex trading platform and felt overwhelmed by what looks like a digital heart monitor… you’re not alone.
Charts are the heartbeat of forex trading – and knowing how to read them properly is one of the most valuable skills any trader can build.
Whether you’re completely new to trading, or just need a clearer understanding of what all those lines and candles actually mean, this guide is for you. We’ll break it down simply, using everyday language, and give you the foundations you’ll need to start trading forex confidently from here in NZ.
What Is a Forex Chart, Really?
At its core, a forex chart is just a visual way of showing how a currency pair’s price has moved over time.
Let’s say you’re looking at NZD/USD. That chart will show how the New Zealand dollar has performed against the US dollar – whether it’s rising, falling, or stuck in a range.
You can choose different timeframes (1-minute, 1-hour, daily, etc), but the purpose is always the same: to help you spot patterns, trends, and key price levels.
The Basics: Line, Bar, and Candlestick Charts
There are a few types of charts, but one has become the most popular by far:
- Line charts: Simple and clean, line charts just connect closing prices. Good for a quick glance, but they lack detail.
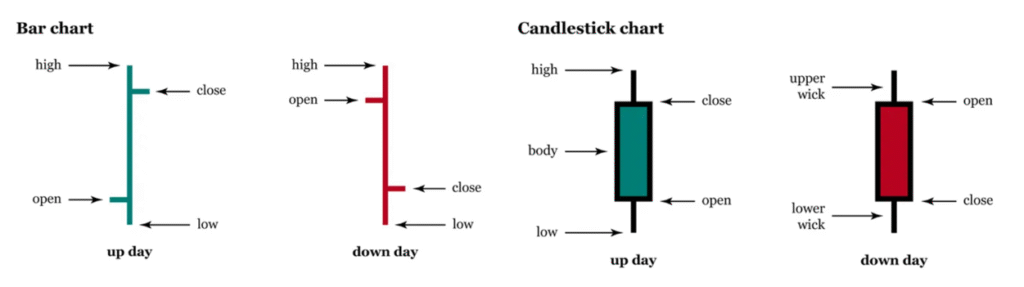
- Bar charts: Show the open, high, low, and close (OHLC) for each period. More info, but less intuitive for most people.
- Candlestick charts: These are the standard for most traders. Each candle shows where price opened, how high and low it went, and where it closed.
If you’re serious about learning to trade, candlesticks are the way to go.
How to Read a Candlestick
Each candlestick has a body and two “wicks” (or shadows).
- The body shows the open and close.
- The wicks show the high and low of the period.
- If the candle is green, price closed higher than it opened.
- If it’s red, price closed lower than it opened.
Simple, right?
Once you get the hang of these, you can start spotting price action clues without relying on too many indicators.
Key Chart Patterns Every Kiwi Should Know
Here are a few classic patterns you’ll see again and again:
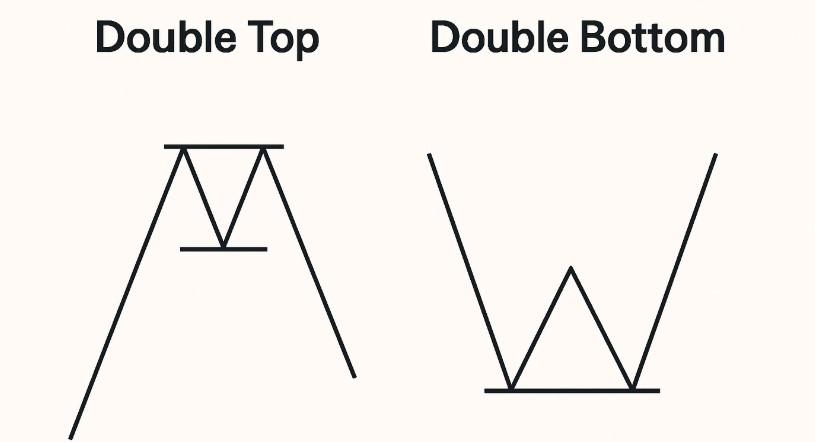
- Double Top / Double Bottom: Signals potential reversal after a strong trend.
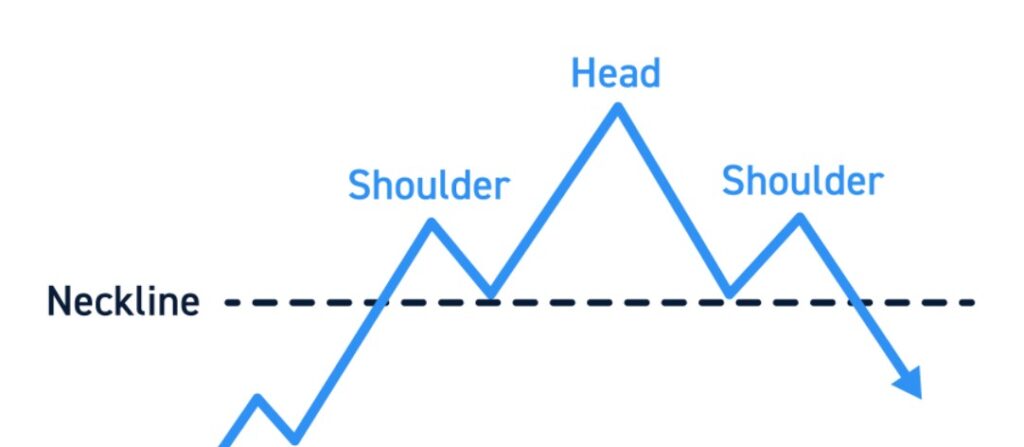
- Head and Shoulders: A reversal pattern that often appears before trend changes.
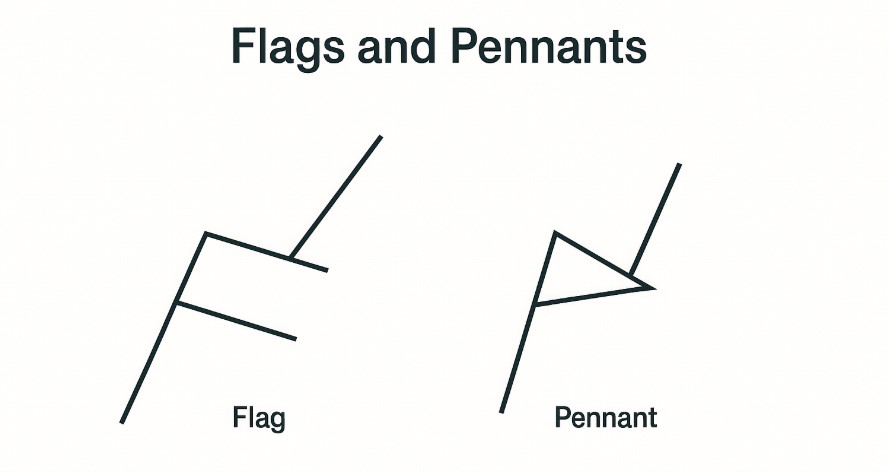
- Flags and Pennants: Continuation patterns that show a brief pause before the trend resumes.
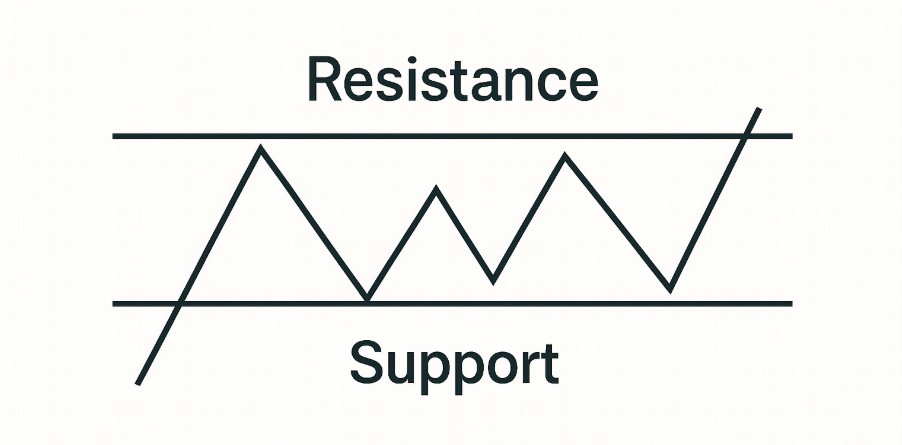
- Support and Resistance Levels: Horizontal lines where price tends to bounce or stall. They’re not magic, but they matter.
You don’t need to memorise every textbook pattern. The main idea is to understand what price is telling you – and whether buyers or sellers are in control.
Reading Charts in the Real World
Here’s a practical way to approach any forex chart:
- Zoom out: Start on the daily or 4-hour chart to see the bigger picture.
- Mark key levels: Identify areas where price has reacted multiple times.
- Look for the trend: Is the market going up, down, or sideways?
- Check candlestick signals: Look for engulfing candles, pin bars, or strong closes.
- Zoom in: Drop to the 1-hour or 15-minute chart if you’re trading shorter-term.
And remember – price action tells the story. Indicators can help, but price is the final say.
Final Thoughts: Keep It Simple, Stay Curious
Reading forex charts doesn’t have to be complicated. In fact, some of the best traders in the world focus on a few clean levels, a handful of patterns, and the rhythm of the market.
It’s not about predicting the future perfectly – it’s about reacting to what the market is showing you in real time.
If you’re just getting started in NZ, the most important thing is to keep showing up, keeplearning, and don’t be afraid to take it slow. With time, those random lines and candles will start to make sense – and eventually, they’ll help guide your trades with confidence.